
Identifying key metricsApni Shala Foundation
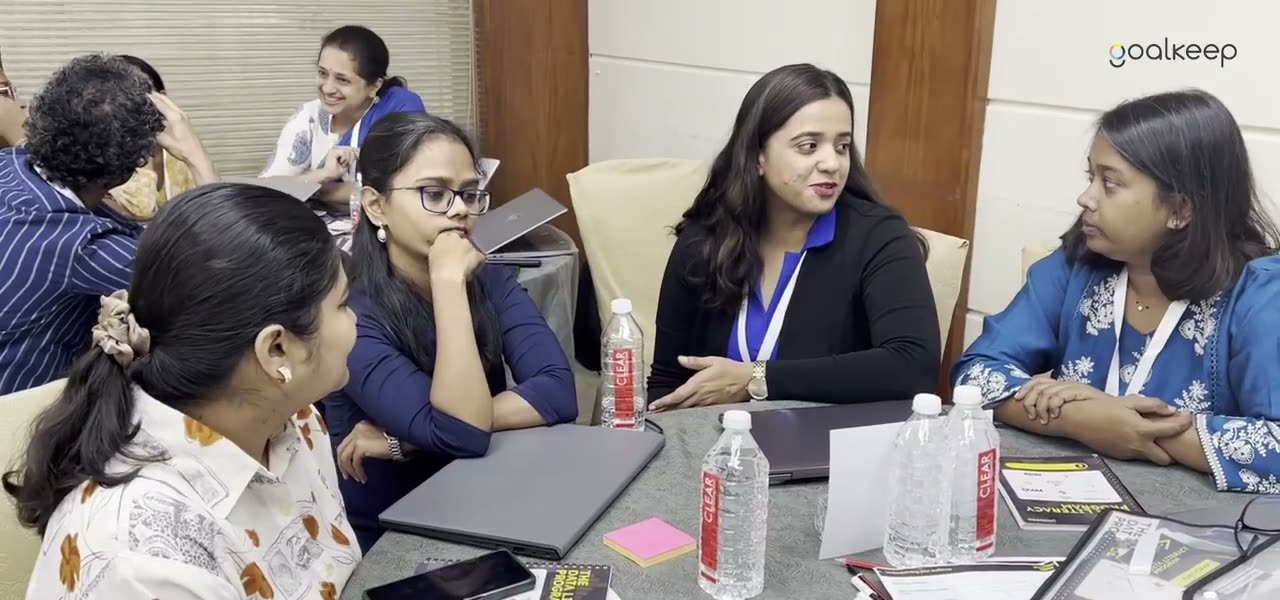
A handful of hero metrics on the weekly dashboard helped Apni Shala quickly identify student learning gaps that used to surface only at year-end previously.
We work with funders, nonprofits, and ecosystem partners to build systems that scale with them, turn data into decisions, and increase data adoption among their teams and cohorts.
A handful of hero metrics on the weekly dashboard helped Apni Shala quickly identify student learning gaps that used to surface only at year-end previously.
Showing 1 of 3: Apni Shala Foundation. A handful of hero metrics on the weekly dashboard helped Apni Shala quickly identify student learning gaps that used to surface only at year-end previously.
Nonprofits, funders and intermediaries across India.



why we exist
Social-sector organisations collect a great deal of data, but too little of it goes back into making better programmatic decisions. Goalkeep builds people-friendly systems and capabilities that turn scattered information into useful insight—so teams can make better decisions, communicate impact clearly and deepen the change they create.
what we do
01 / Strategy
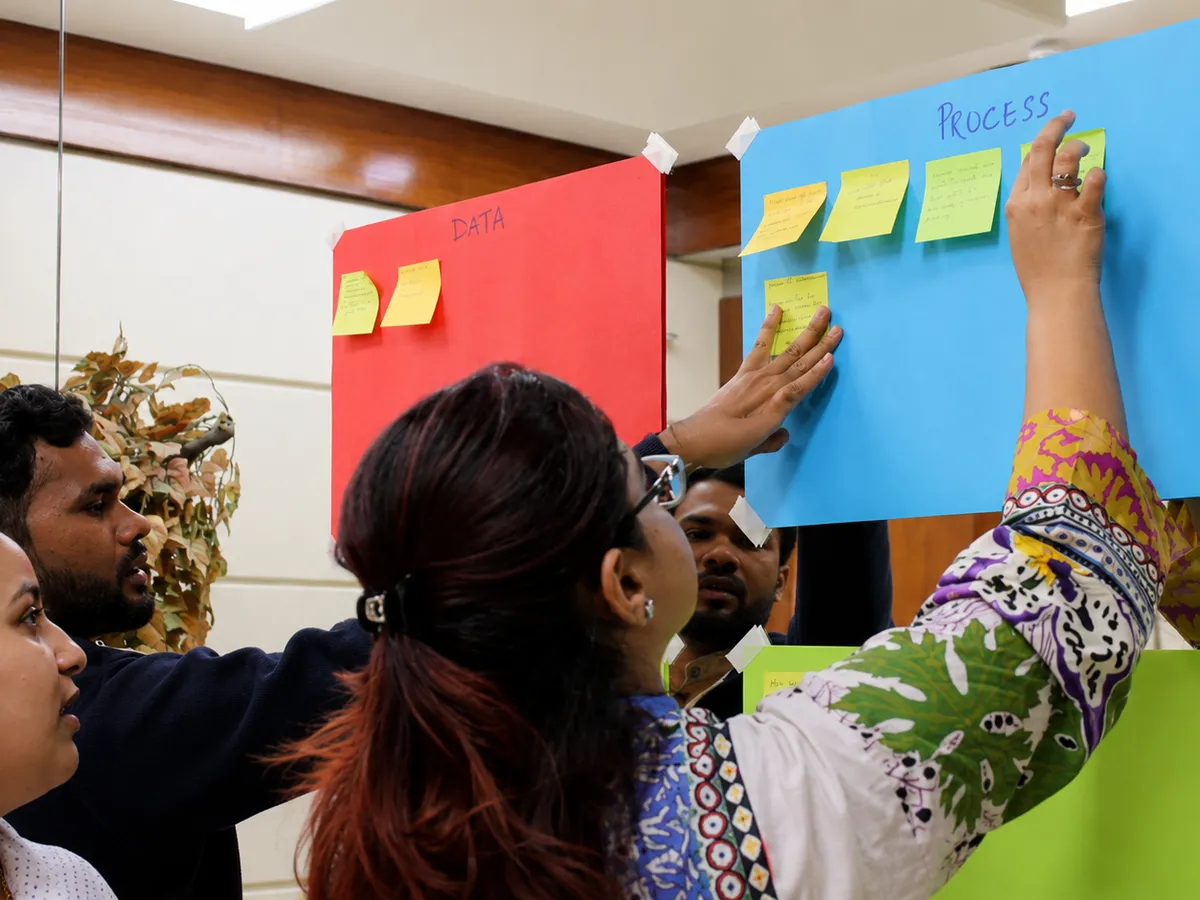
Sharpen your Theory of Change and turn it into a practical measurement framework. We enable teams to identify the decisions that matter, define measurable outcomes and indicators, and develop frameworks that can actually be used.
02 / Systems
Build a data stack that can grow with your organisation. We design cost-effective, fit-for-purpose systems, ETL workflows and reliable pipelines that collect, transform and connect data across tools—providing a strong foundation for unlocking actionable insights.
03 / Dashboards
Design dashboards around the questions each team member needs answered. We translate role-specific decisions into clear views and reports, so leaders, programme teams and MEL staff see what matters—not endless charts and countless metrics.
04 / Adoption
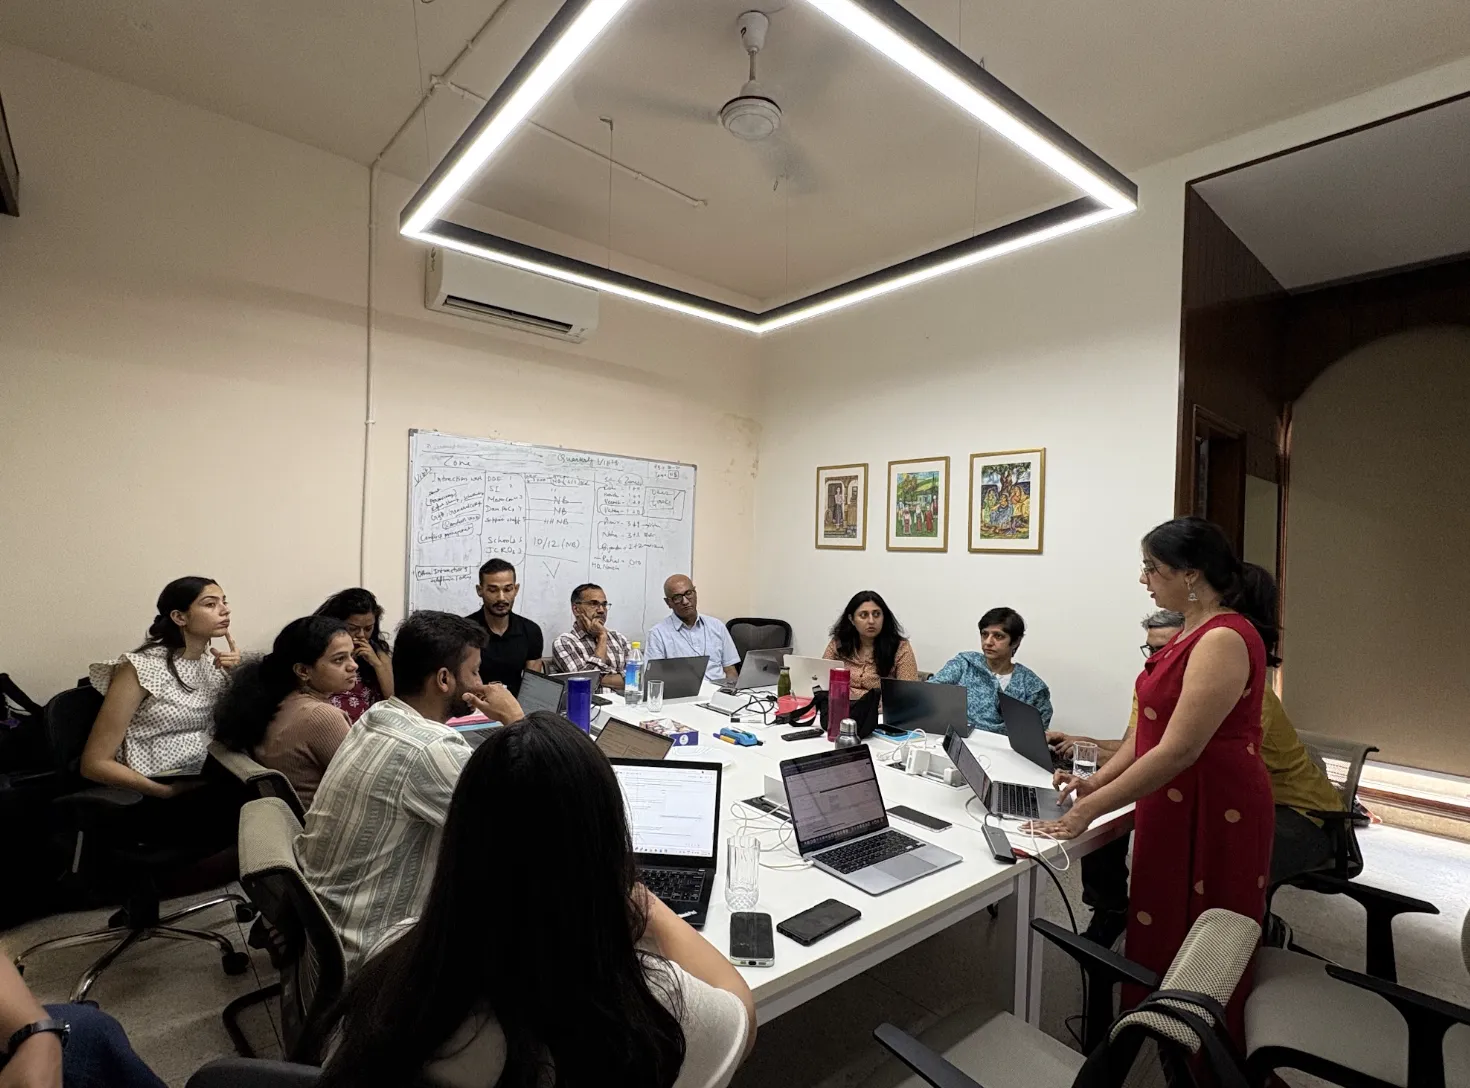
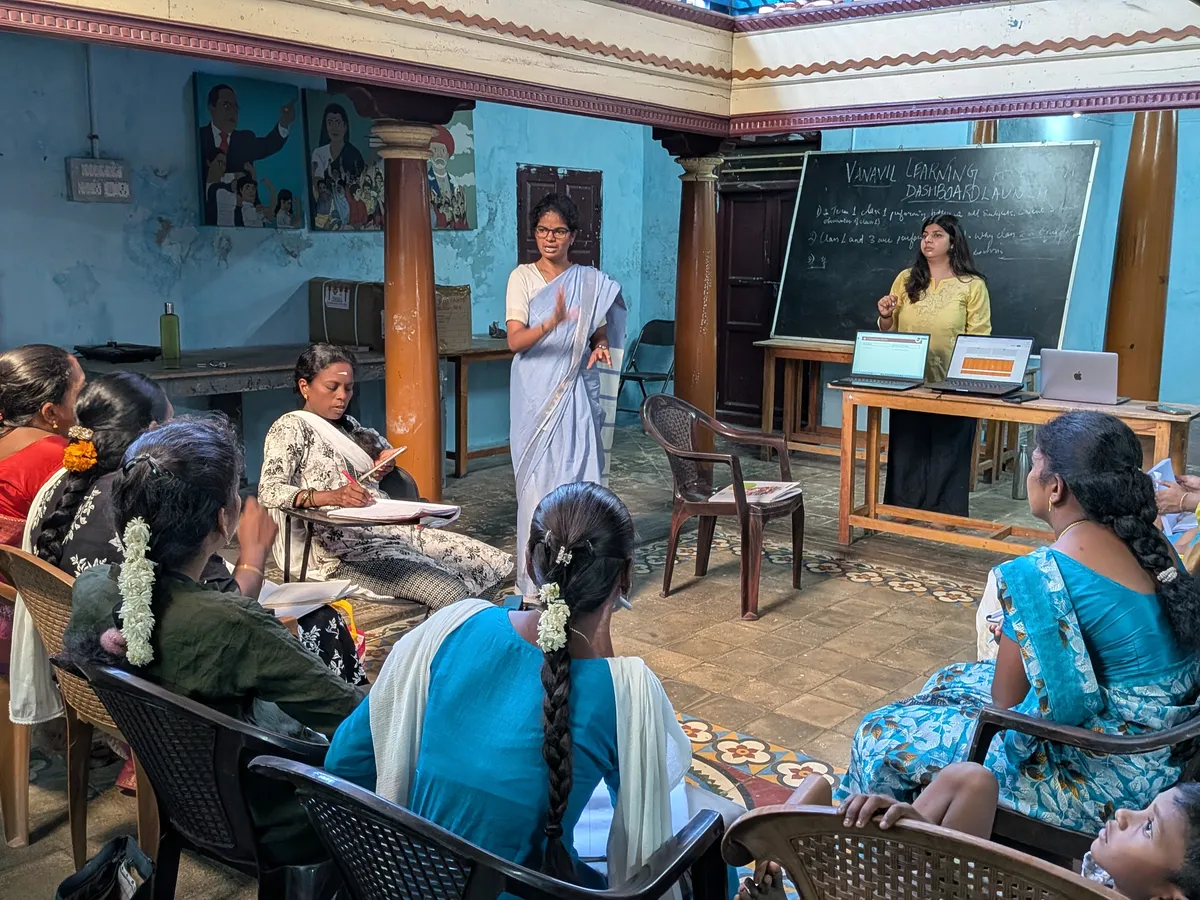
We build data confidence through role-specific training and practical team routines. From field staff and MEL specialists to executive leadership, we enable organizations to navigate data without overwhelm and make smarter decisions every day.
Your data may live across forms, spreadsheets and individual trackers, making it slow to understand progress or communicate impact. We help bring it together in a practical, affordable system that reduces manual effort, makes change visible over time and grows with your organisation.
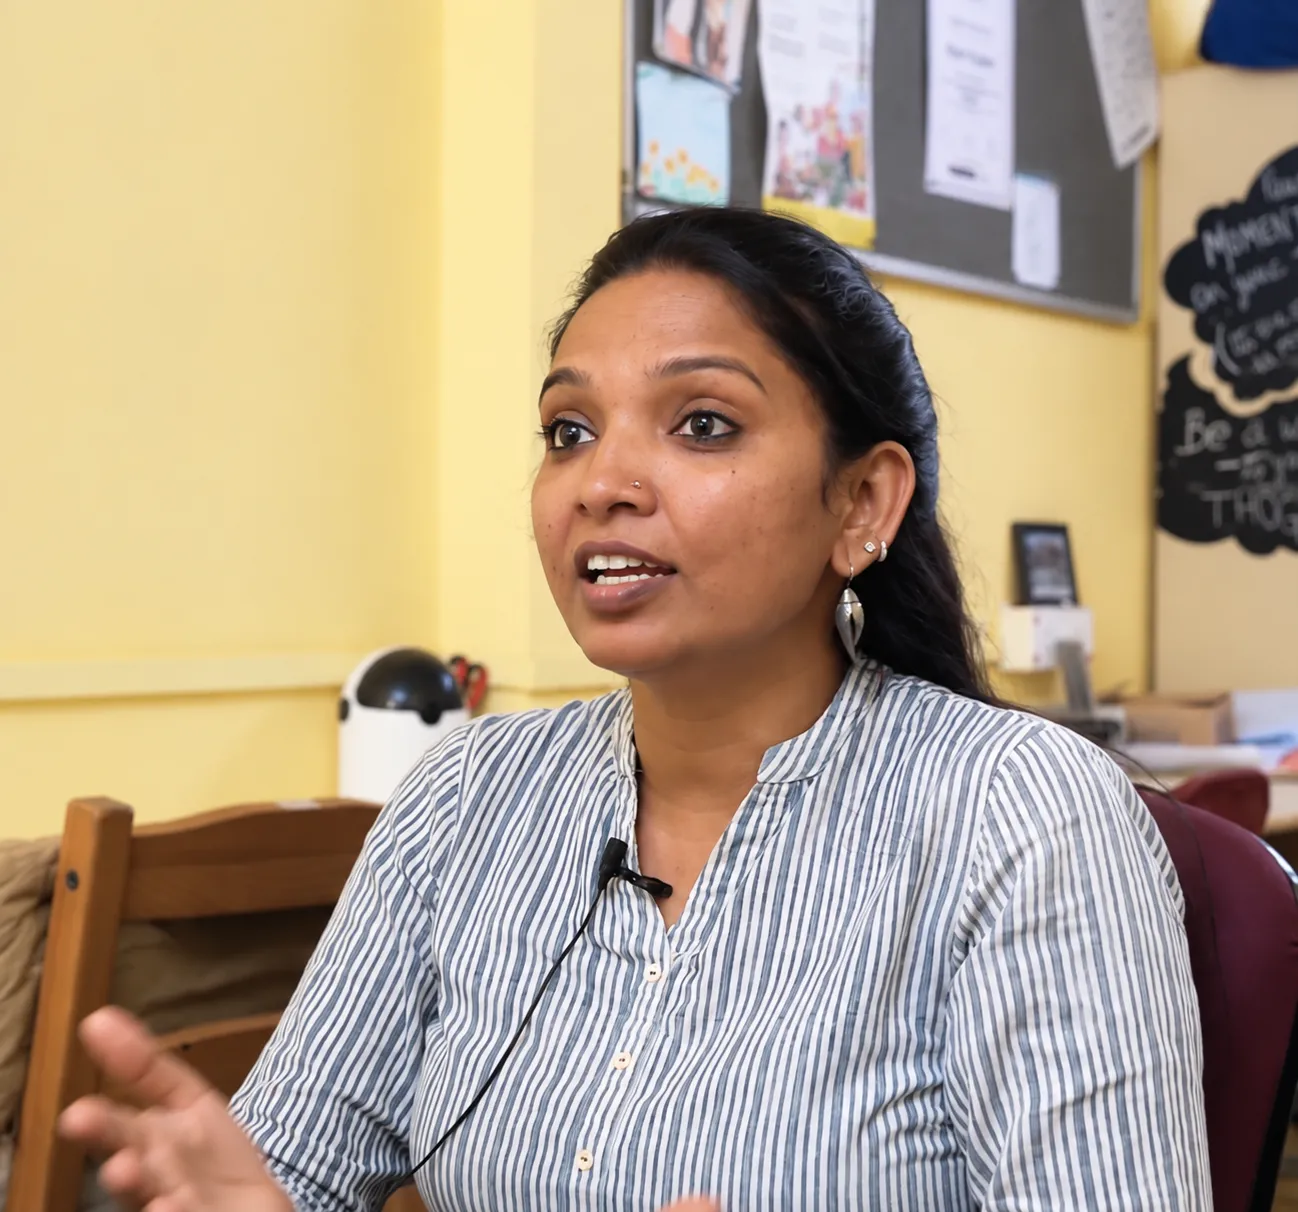
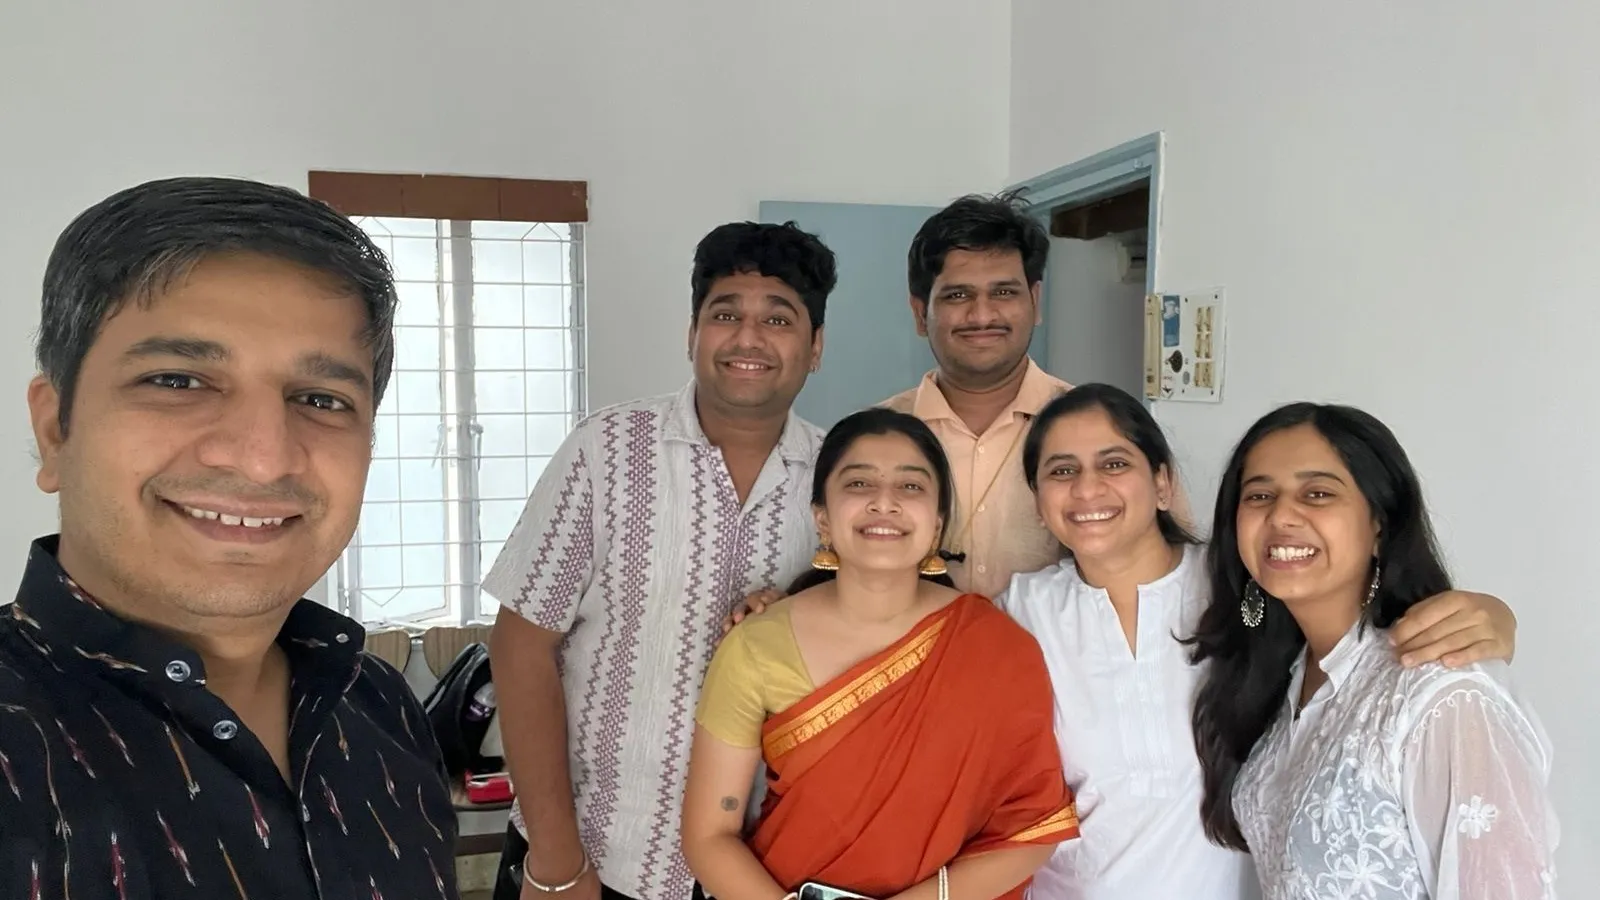
“We end up capturing a lot of data, but it’s the first time we’ve stepped back to think of what are the key findings we really want our data to shed light on as an organisation. We are now at a place to be making less emotional, and more data-driven decisions.”
our approach
Start with the decision, not the dashboard.
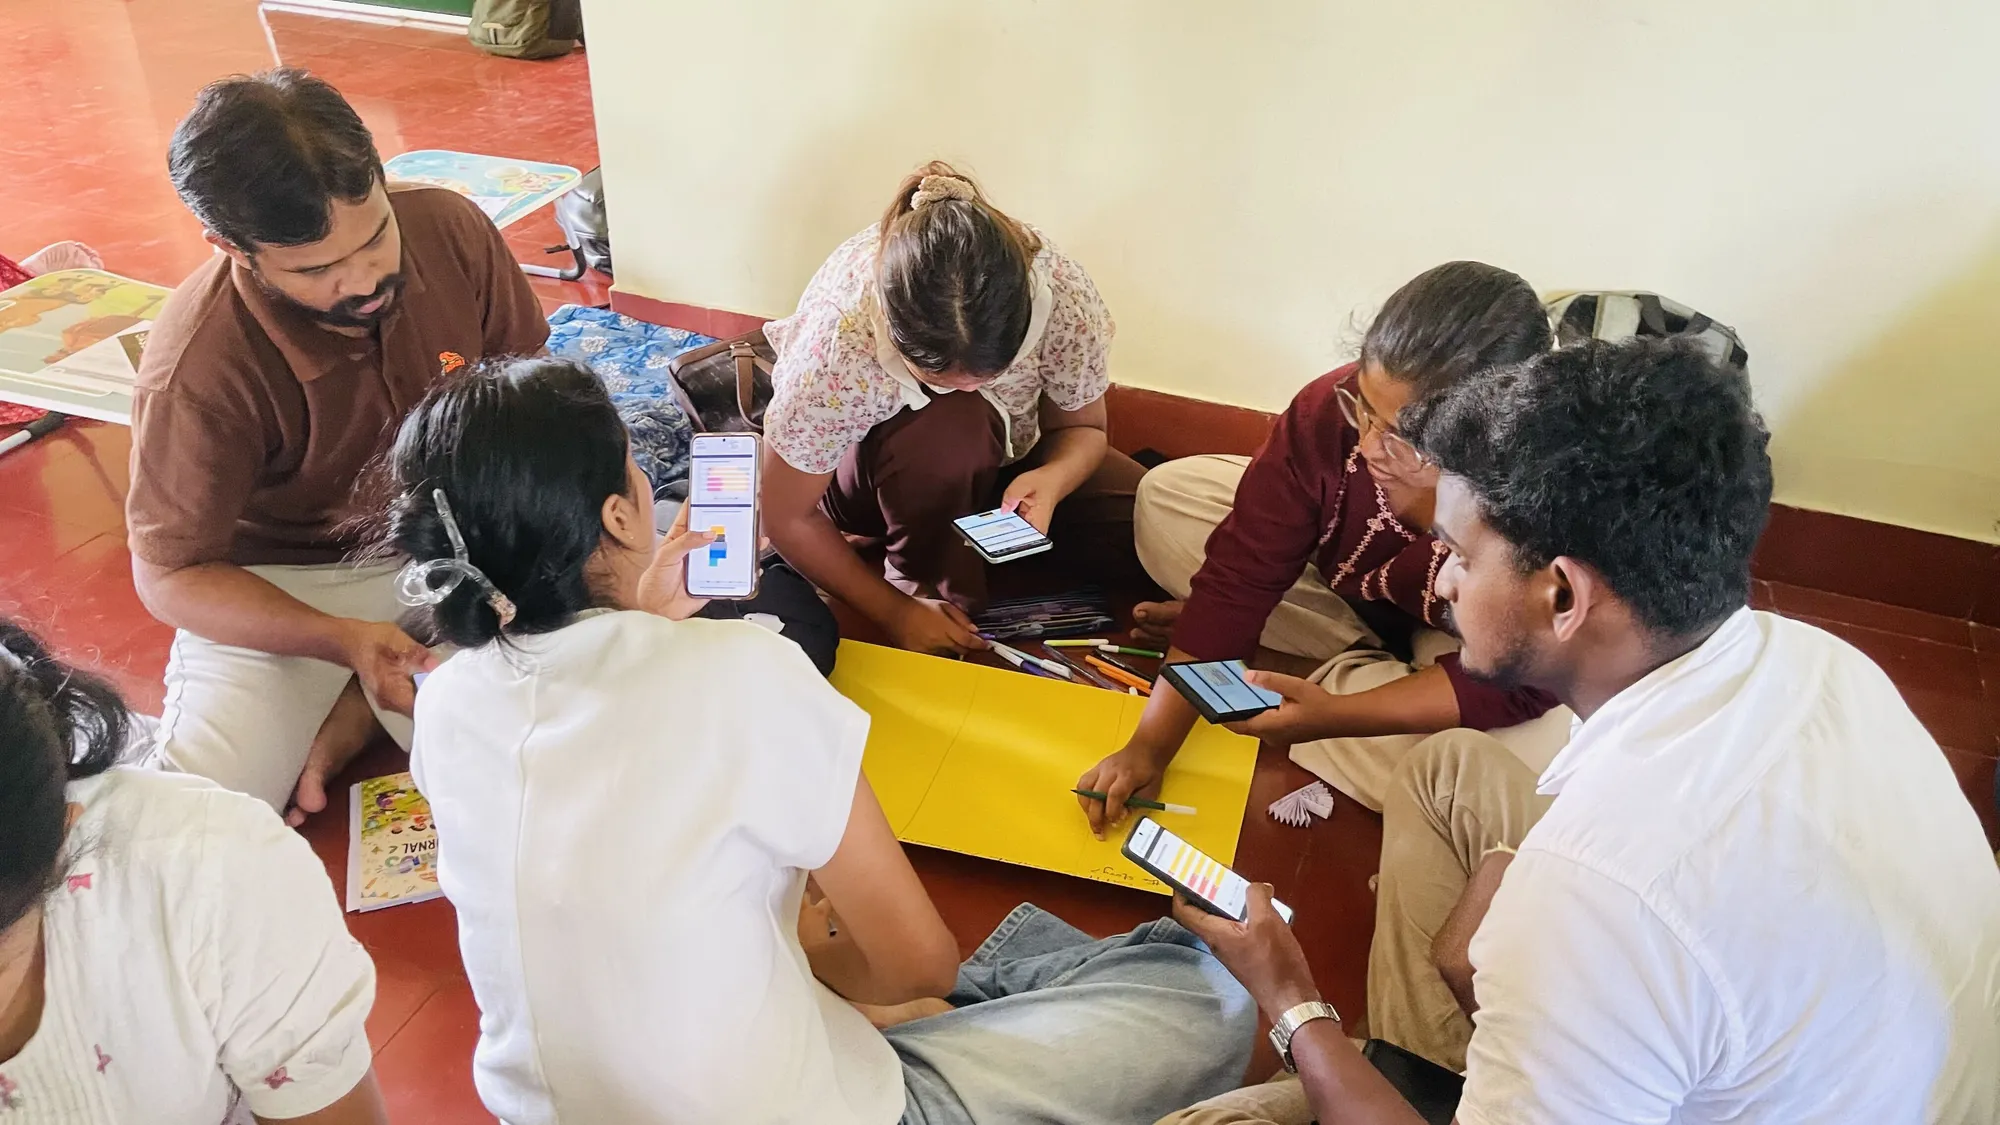
Are you collecting data because it is useful—or because it has always been collected? What decision should each metric inform? We start with the outcomes you want to move and the actions people need to take, then design the measurement framework, questions and views that support them.
Build once, and let your system scale with you.
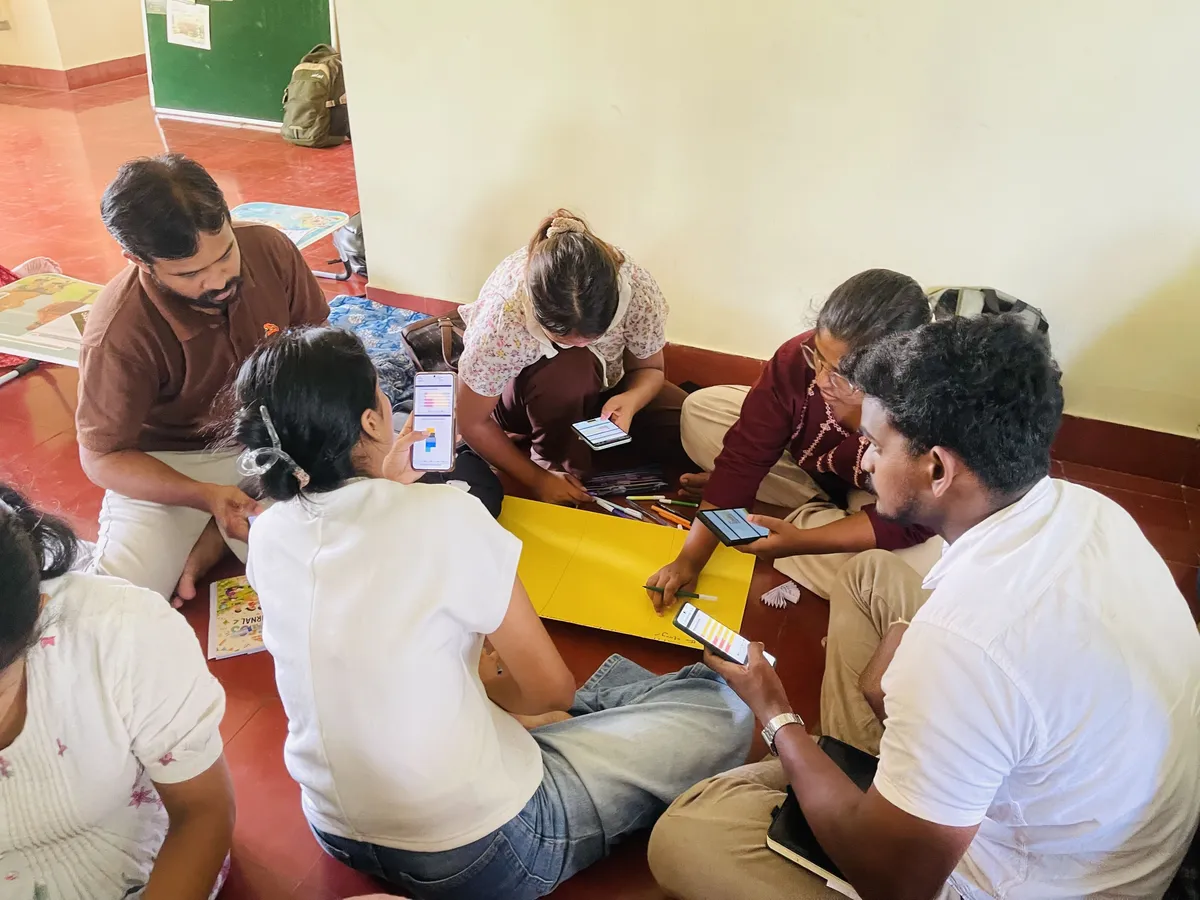
Has every new request created another tracker, sheet or dashboard? We replace the pile-up with streamlined, cost-effective pipelines and systems that are clean, fast, maintainable and designed to grow with your organisation.
Make data part of how people work.
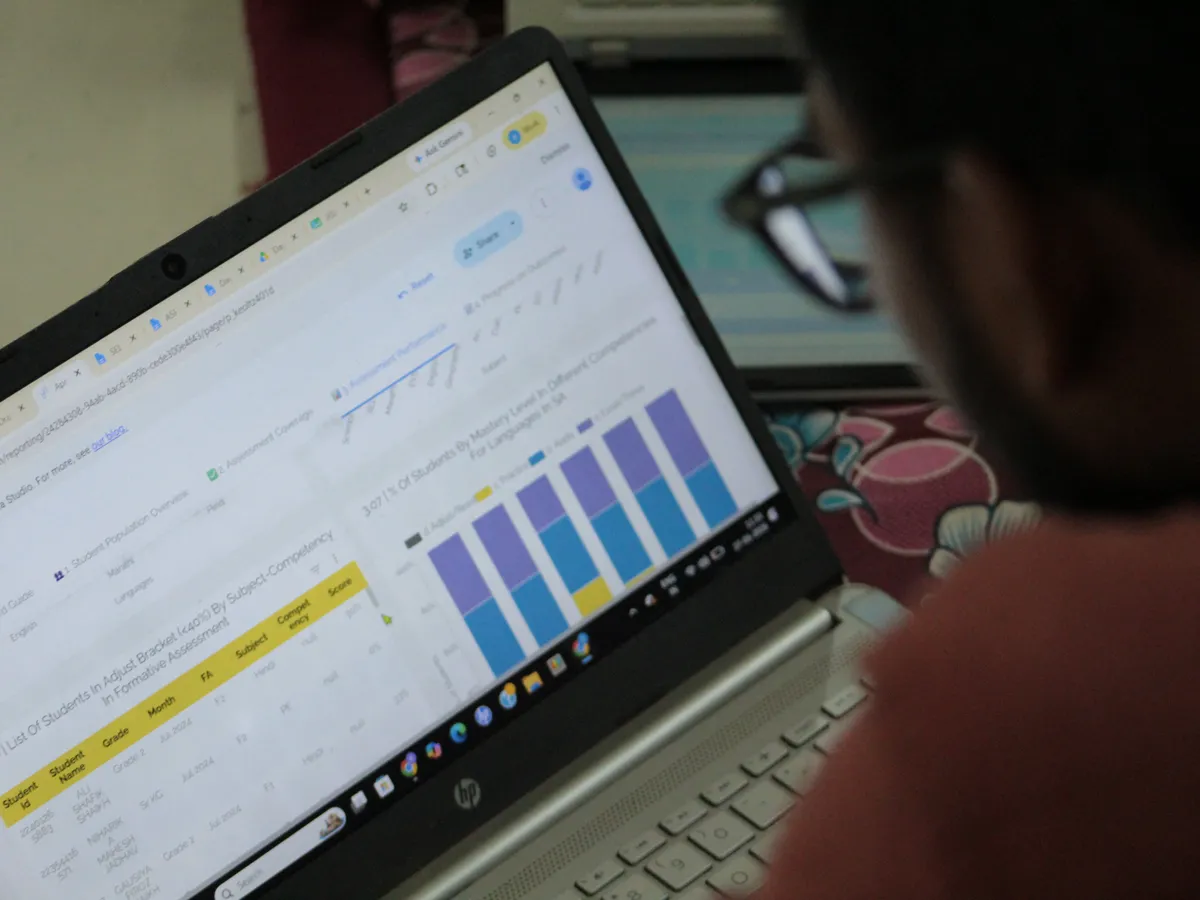
Will the system be used once the launch is over? Technology creates value only when people have the confidence and capability to use it. Our data literacy curriculum, role-based training and team routines help everyone—from field staff to MEL teams and leaders—use data in practice.
the short version
people trained
reduction in average time spent on reporting
increase in data systems adoption
of partner organizations now using data to make decisions
case studies
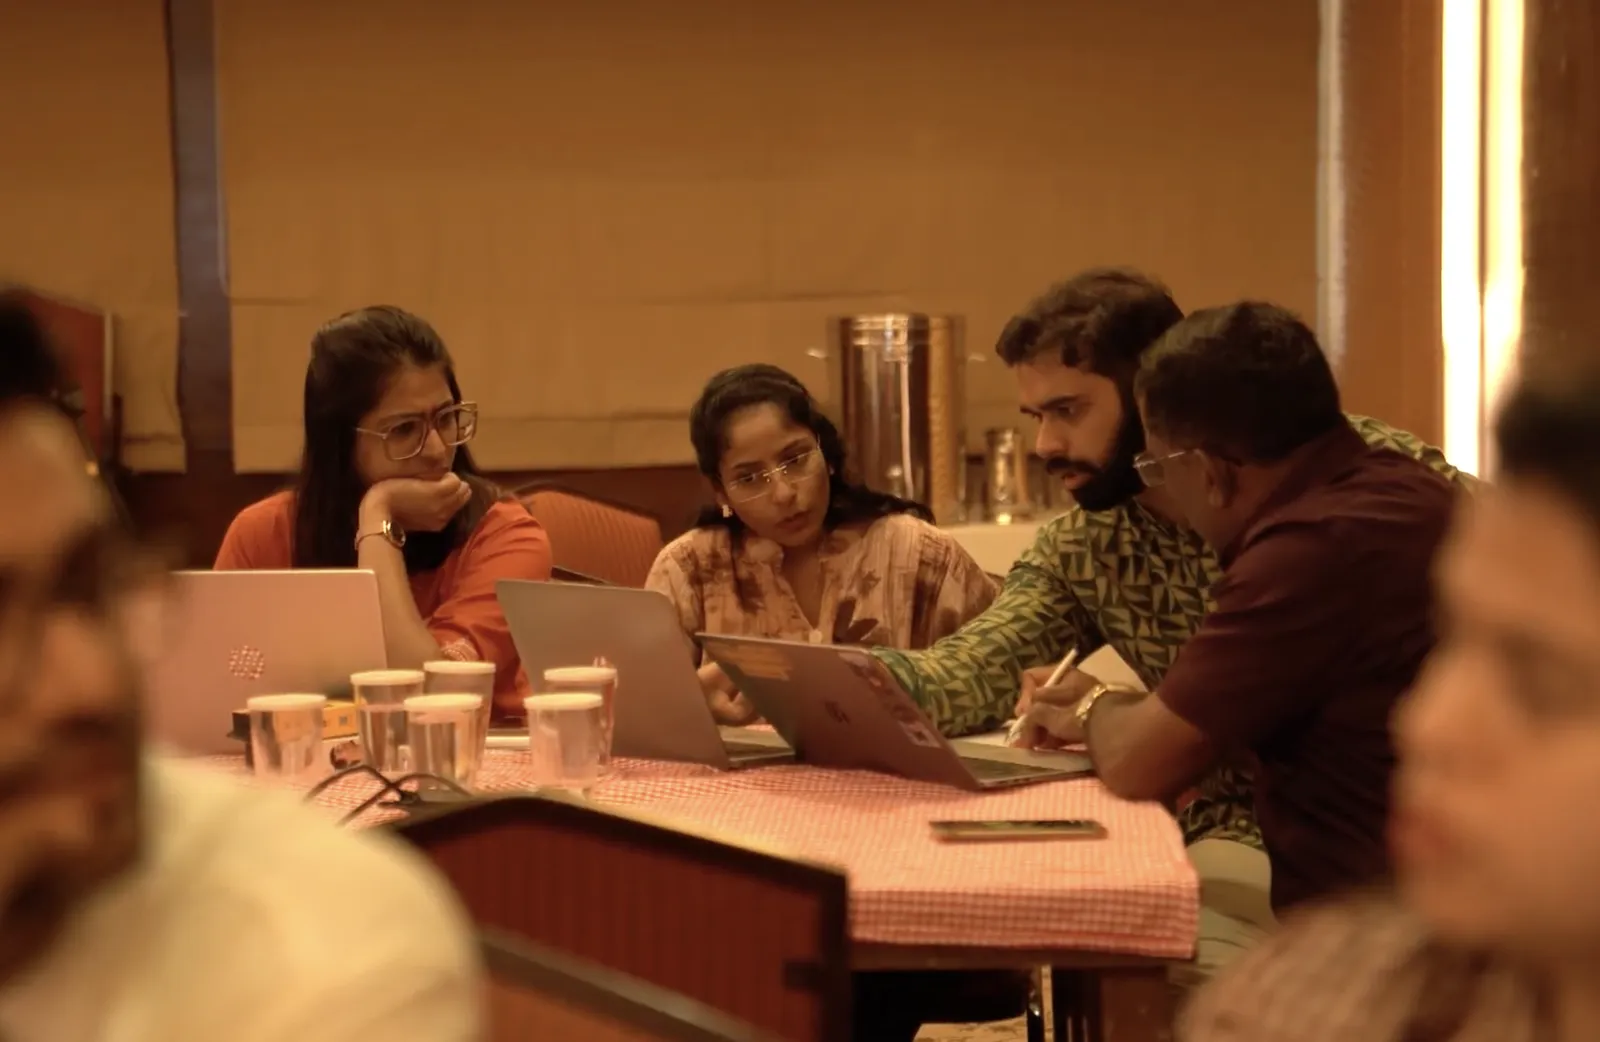
A real-time data system that we built for Baithak Foundation played a pivotal role in closing a ₹25 lakh grant. What convinced the funder wasn’t just the dashboard metrics, but that every person on the team also used that data regularly.
Conducted capacity building workshops to help 16 organizations in their cohort map their ToC to measurable indicators.
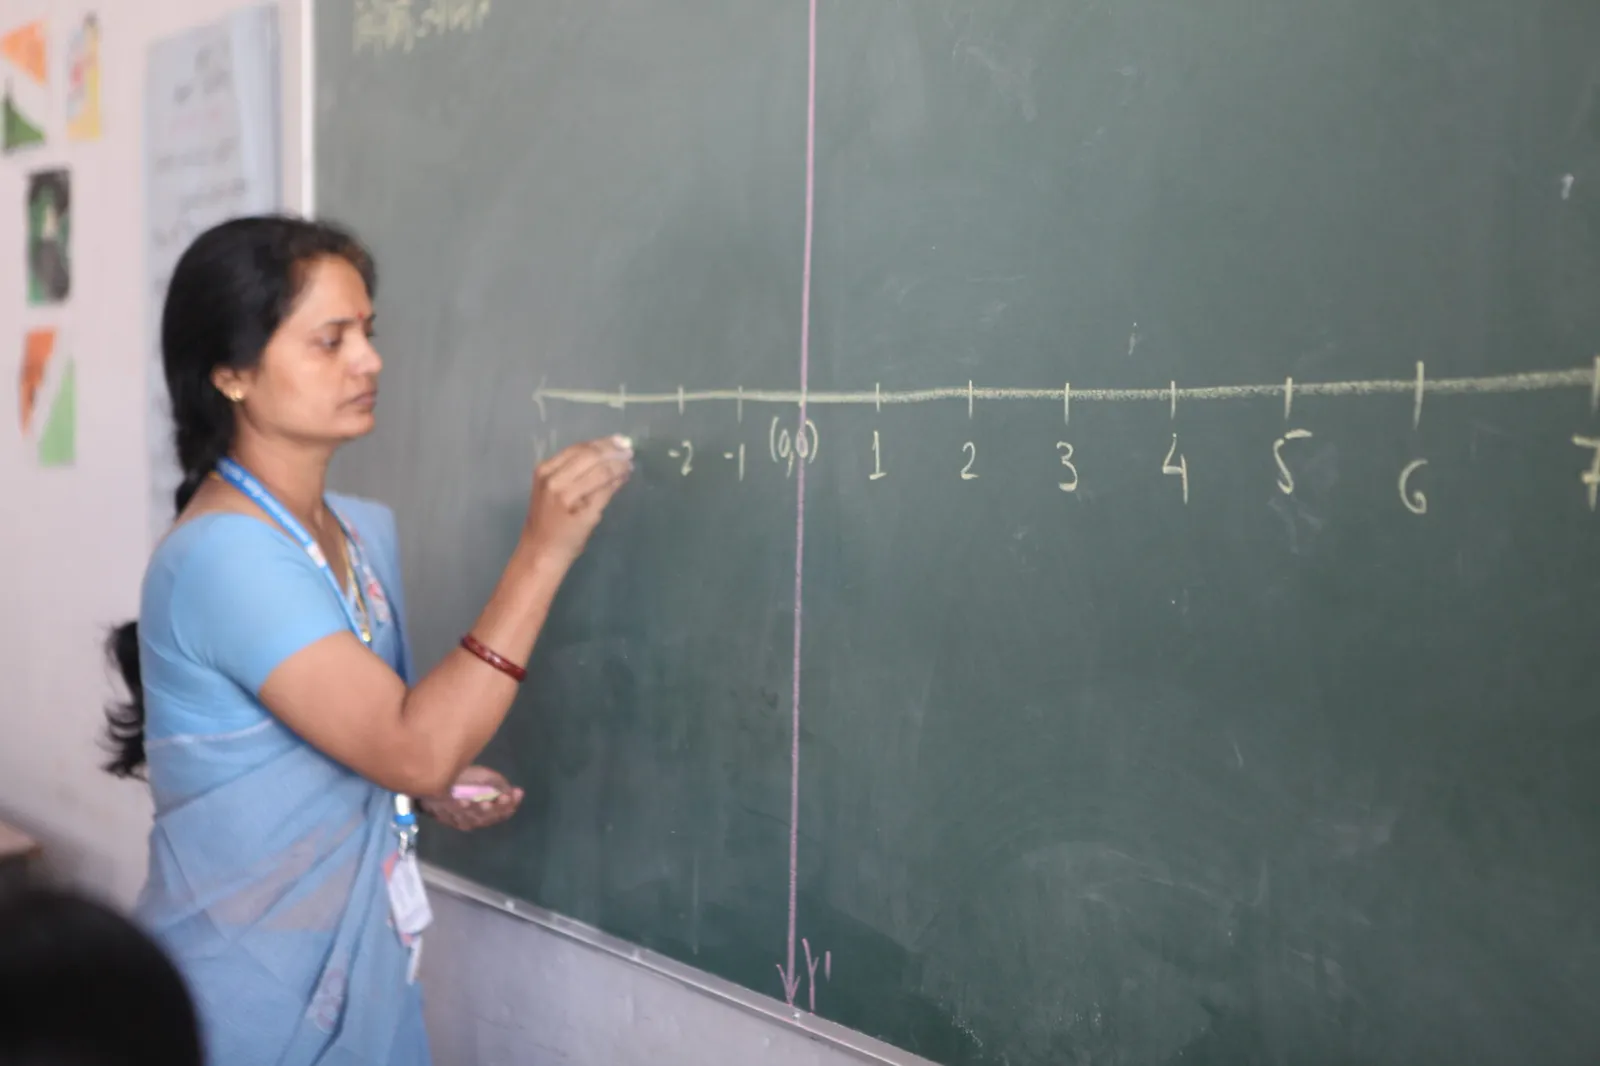
Nineteen organisation-level indicators and a leadership dashboard helped Peepul more effectively monitor their programs as they scaled to having 8 programs across 2 states.
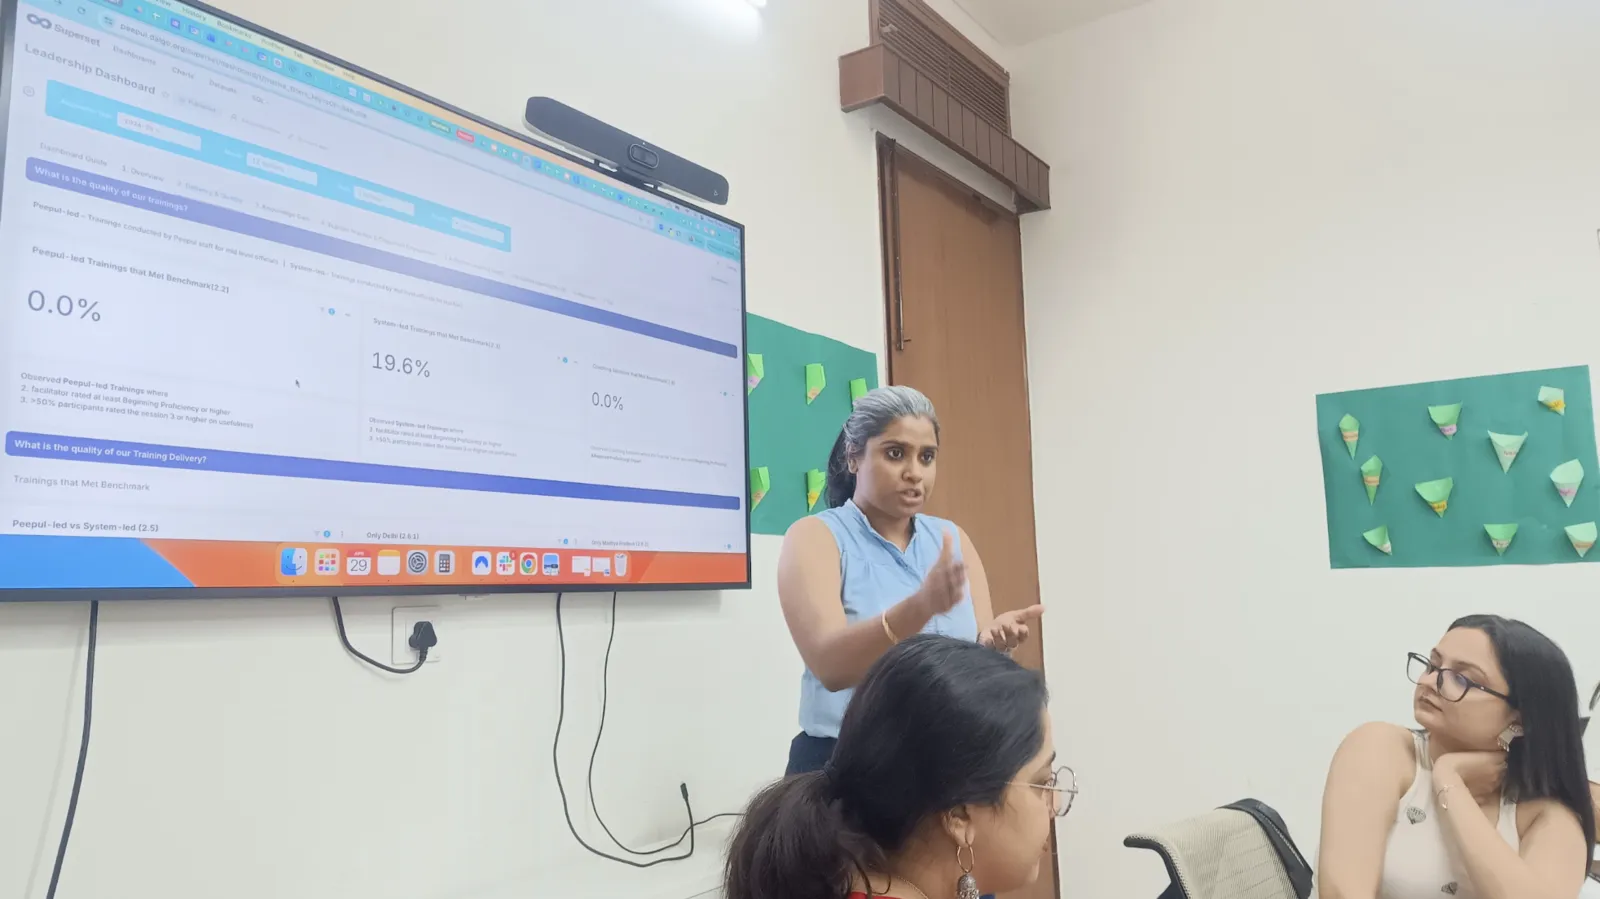
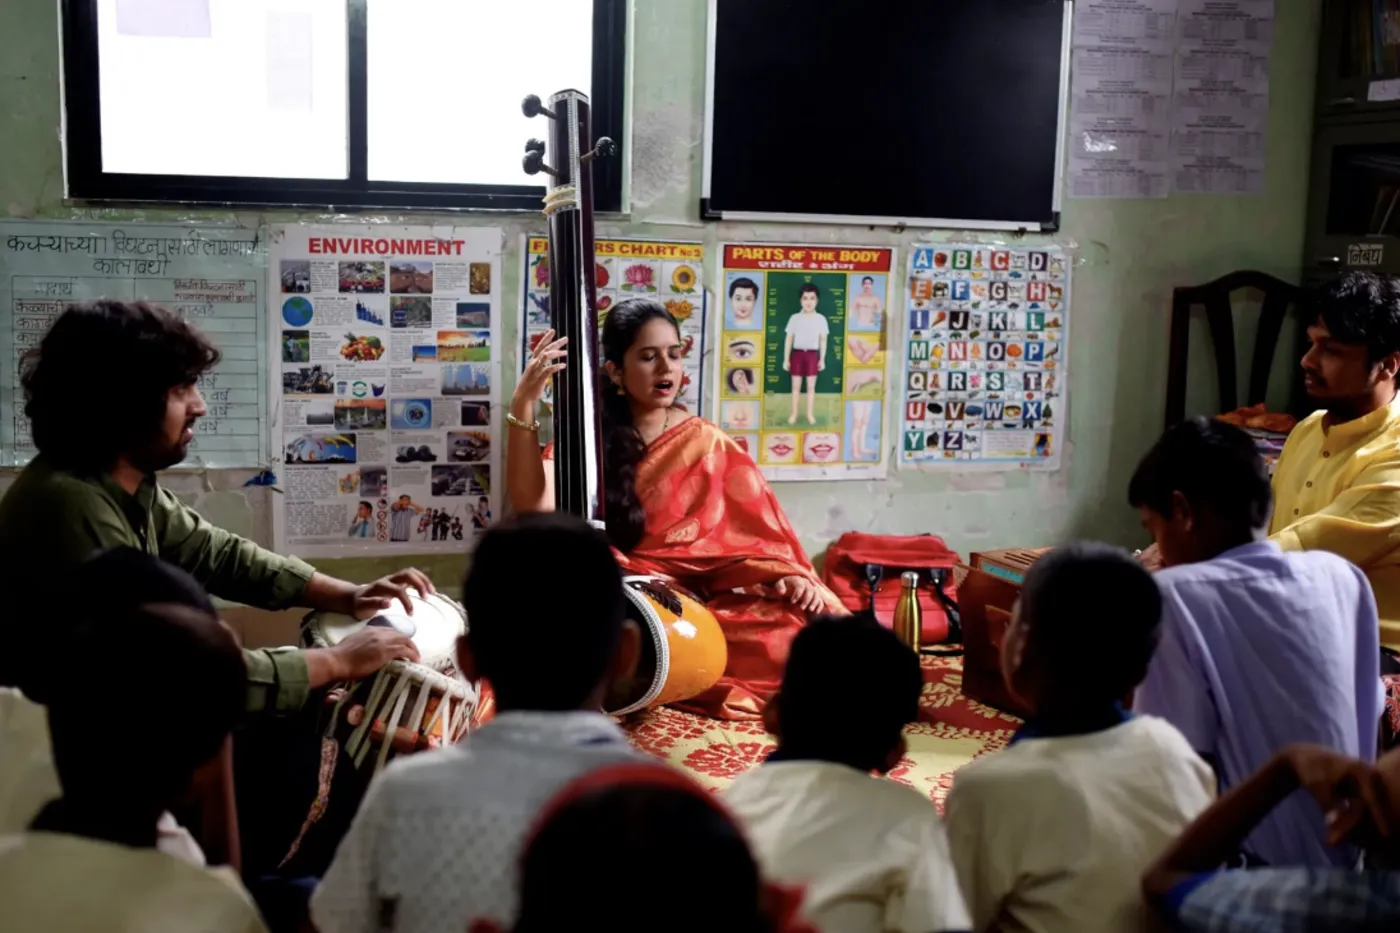
A handful of hero metrics on the weekly dashboard helped Apni Shala quickly identify student learning gaps that used to surface only at year-end previously.
Yes. We help identify which data is useful, reduce duplication and manual effort, connect scattered sources, and create workflows that make information easier to analyse, communicate and act on.
We favour an open-source data stack and avoid locking organisations into proprietary Goalkeep software.
Depending on the need, the open-source core may include technologies such as PostgreSQL or Supabase for the database, supported by tools such as GitHub for version control and Vercel for hosting where appropriate. The exact stack is selected around the organisation’s workflows, budget, existing systems, security needs and ability to maintain it.
Yes. We don’t begin with a generic list of metrics. We start with your Theory of Change, the outcomes you are working towards and the questions your programme teams, leadership and funders need the evidence to answer.
We then review what you already collect and help you prioritise a focused set of indicators, with clear definitions, calculations and data sources. Each metric must pass three tests: does it reflect the change you are trying to create, is it feasible and responsible to collect, and will it help someone learn, decide or communicate more clearly?
During our engagement, we address two questions. First, does the dashboard answer questions people genuinely have and help them make decisions they are responsible for? If not, you may want to consider redesigning it. Second, do people have the confidence and skills to use it? Role-based training, guided data reviews and regular team routines help increase dashboard adoption across all levels in your organization.
Often, yes—but teams may need focused expertise to design the measurement framework, data architecture and adoption journey while building internal ownership. Goalkeep brings measurement, data-engineering, dashboard and capacity-building expertise, and works with your team so the system remains useful after the engagement.
talk to us
Leave a few details and we’ll get back to you.