
The need was not just to bring data together, but to measure what mattered to Baithak and make it useful to the people running its programmes.
Baithak Foundation works to make Indian traditional music and dance accessible to children from marginalised communities, and has grown from a weekend activity in 2016 to reaching over 8,000 children across 137 public schools and community centres.
For an organisation built by musicians and artists, the big question was how to communicate its impact. In a Baithak session you can see children focusing for longer and regulating themselves through the art form, but across 137 schools there was no consistent way to capture that change. There was a time when the founders, Mandar and Dakshayani, could visit every school and gauge it themselves, but as the organisation grew this was no longer sustainable. Three questions became particularly important:
- Are children getting the exposure they need? At scale, are all students attending enough sessions, which schools need immediate attention, and which art forms have they not yet experienced?
- Are sessions enabling children to grow? Participation alone could not capture the depth of children’s experiences, so Baithak also wanted to understand engagement, progression in skills and the role of teachers.
- How are these observations informing the work? Without a consolidated view of the data, programme teams found it harder to identify gaps across schools and respond to them.
1. Defining What to Measure
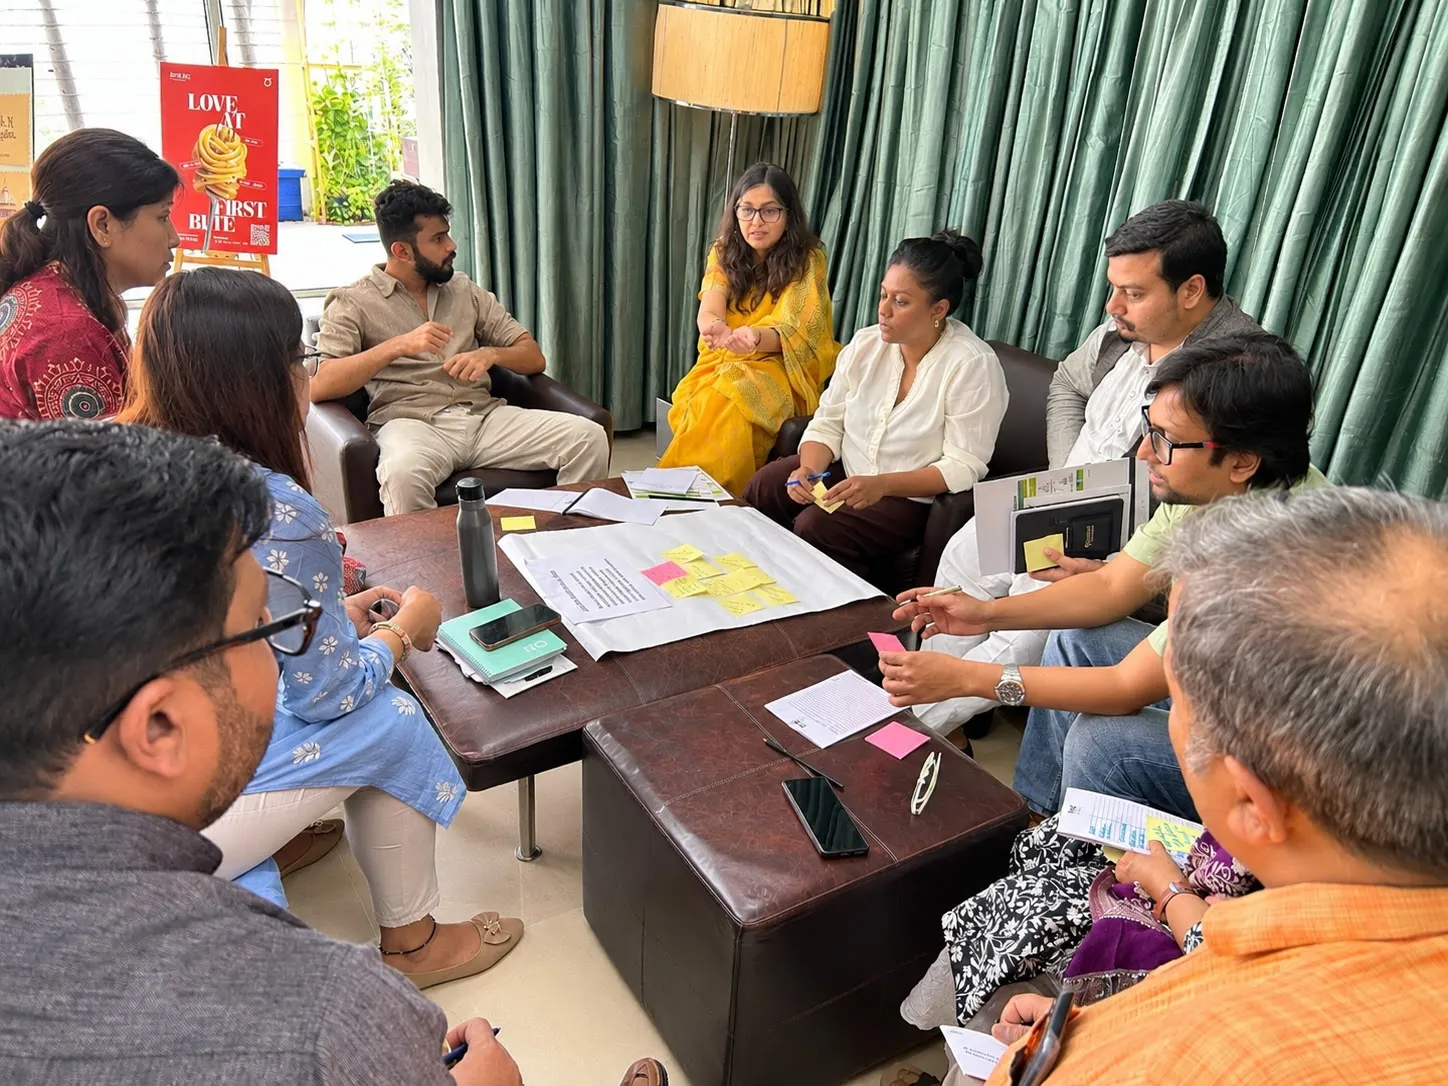
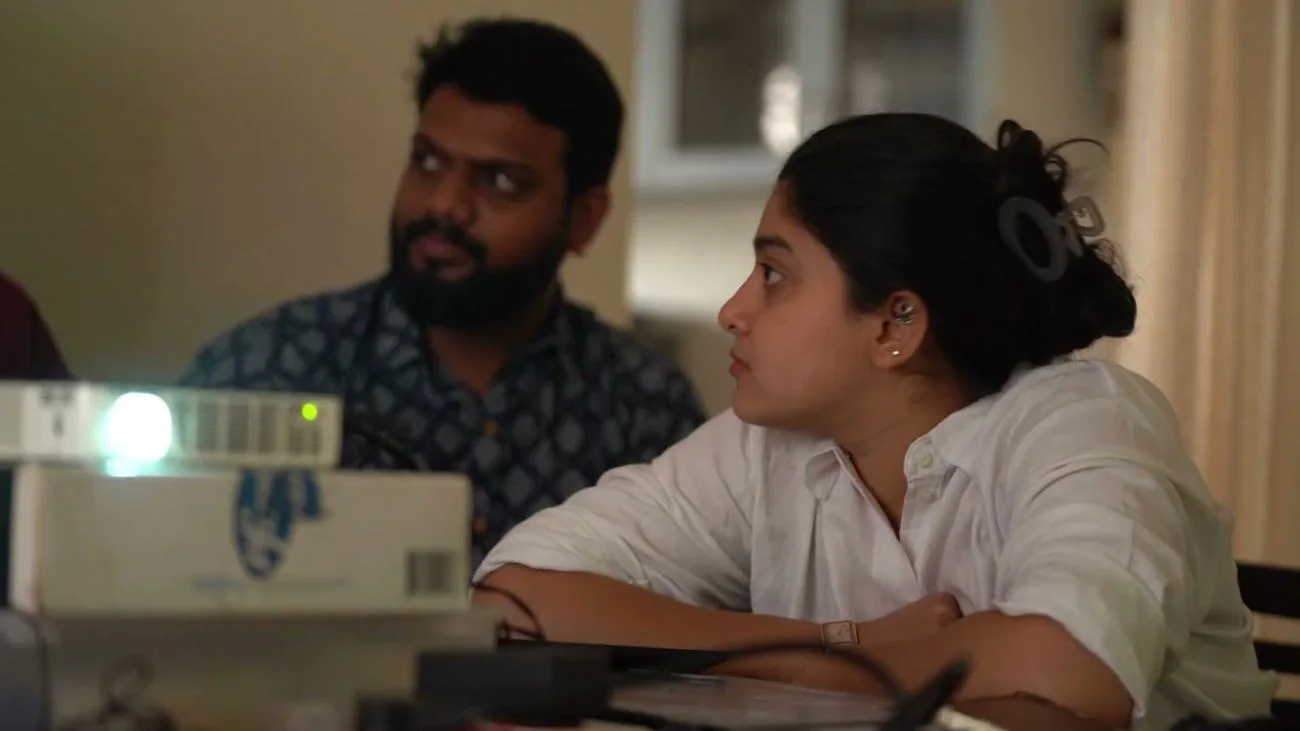
The first step was to sit with Baithak’s teams and define what change in their students really looked like. The framework brought together indicators of reach, such as how many children participate, how often and the range of art forms they experience, alongside indicators of depth, including engagement, progression in skills and teacher involvement.
2. Bringing the Information Together
We built a single source of truth for Baithak’s programmes, with the schools it works with, sessions completed, feedback received and children’s growth all in one place. A Looker Studio dashboard, powered by Google Sheets, consolidates the data automatically as it is collected, so every record adds to the overall picture of the programme.
3. Making Data Part of Programme Decisions
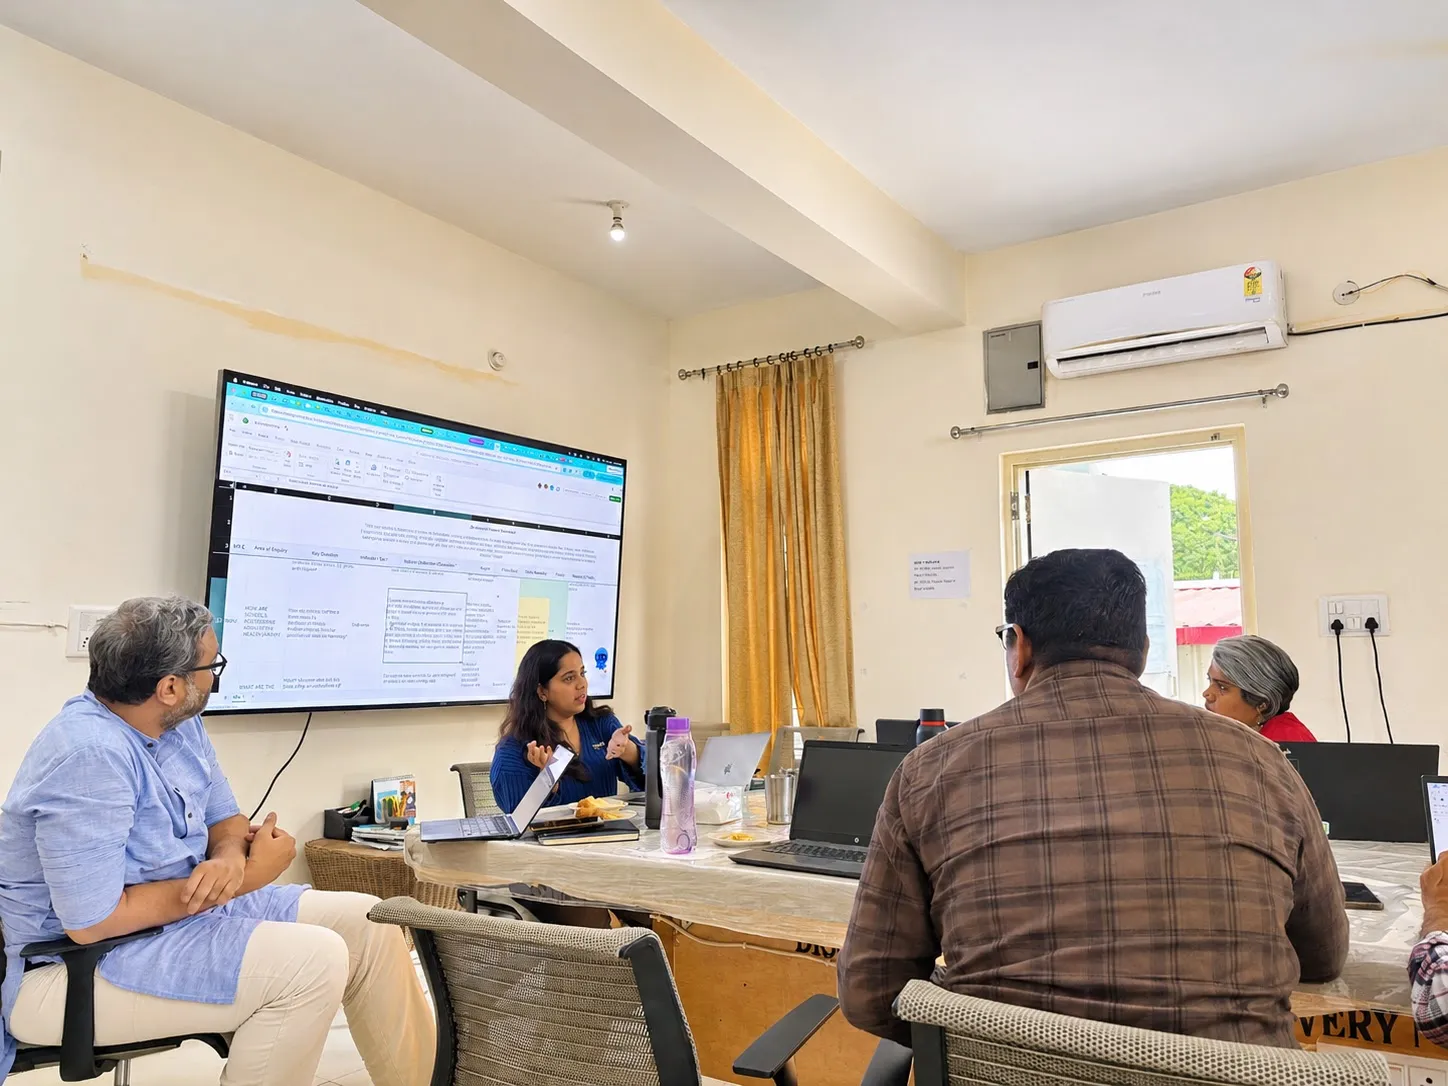
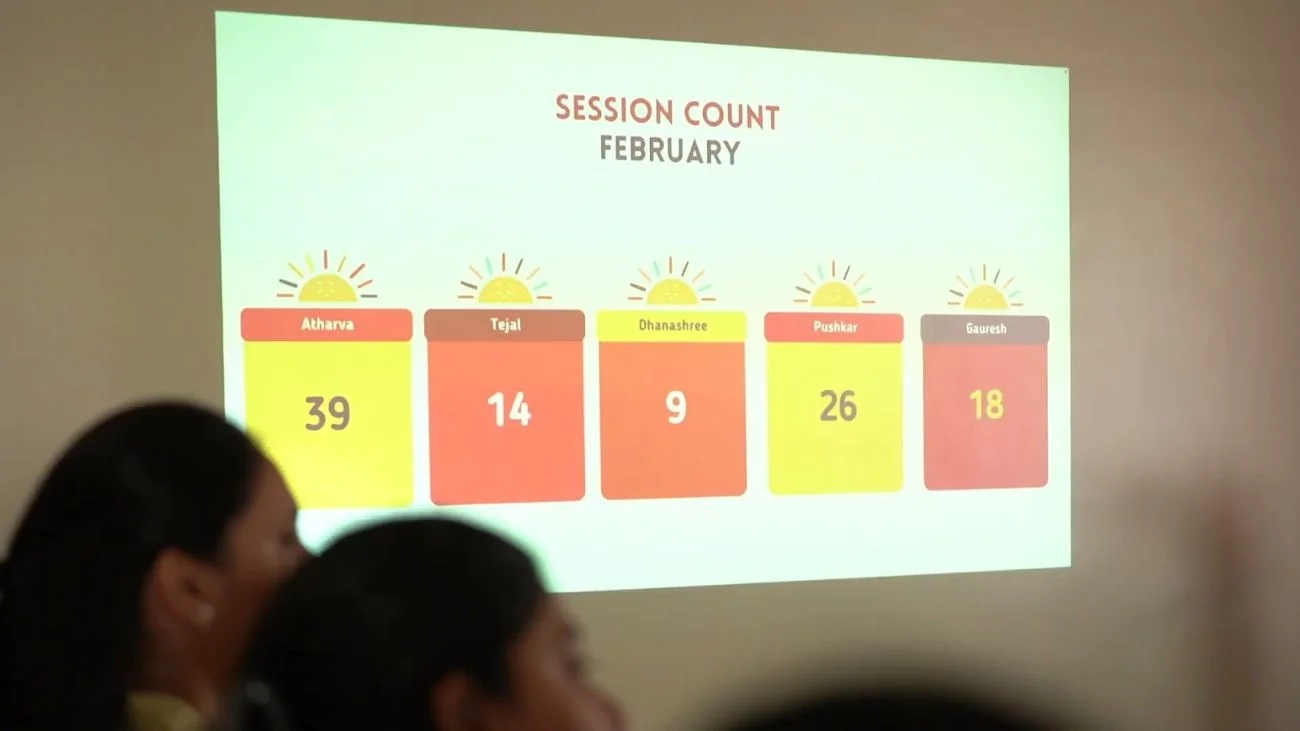
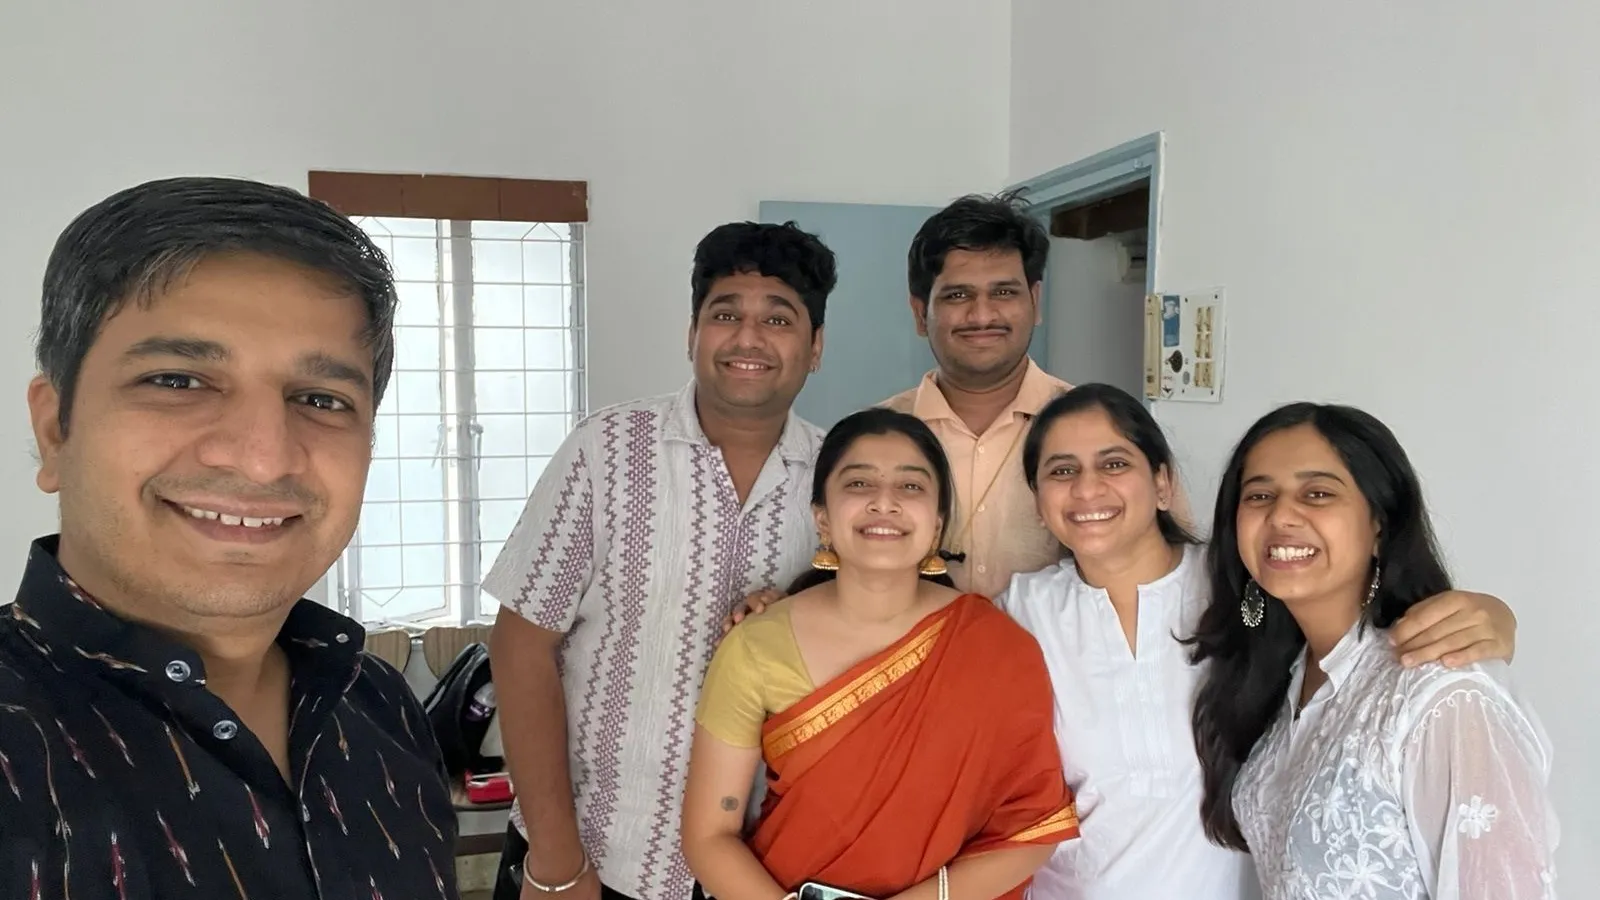
Today, Baithak’s monthly review starts with a team member projecting the dashboard on the wall and leading the discussion, while the founders take part as participants. The team decides what to work on in the coming month and celebrates the previous month’s wins, and anyone can point out that a school has fallen behind on sessions, whether or not it is theirs to manage. Nobody has to chase sheets or clean data, so the conversation stays on what to do next.
- A data framework covering reach, such as participation and exposure to art forms, and depth, such as engagement, skill progression and teacher involvement
- A consistent way to read what registers, forms and teacher observations say about children’s experiences
- A Looker Studio dashboard, powered by Google Sheets, bringing together access and engagement data across schools
- A clear basis for spotting gaps in access and engagement, reviewed by the team every month
- Annual funding grew from ₹1 crore to ₹1.7 crore over this period, alongside three multi-year CSR grants
- A structured evidence base to explain the reach and depth of children’s experiences, as part of a broader organisational effort
For organisations built around an experience like music or dance, the most meaningful change can feel the hardest to measure. This project reinforced that it starts with agreeing on what change actually looks like, and then measuring both reach and depth so that neither number has to tell the whole story on its own.
Once the data sat in one place, its value showed up in the room: a monthly review led by the team rather than the founders, focused on what to do next instead of on cleaning sheets.
The process helped us clarify our focus and key questions. That itself was a big benefit. We’ve moved from focusing just on efficiency to thinking about quality and the deeper aspects of our work.