

LivelihoodsEducation
Vanavil Trust
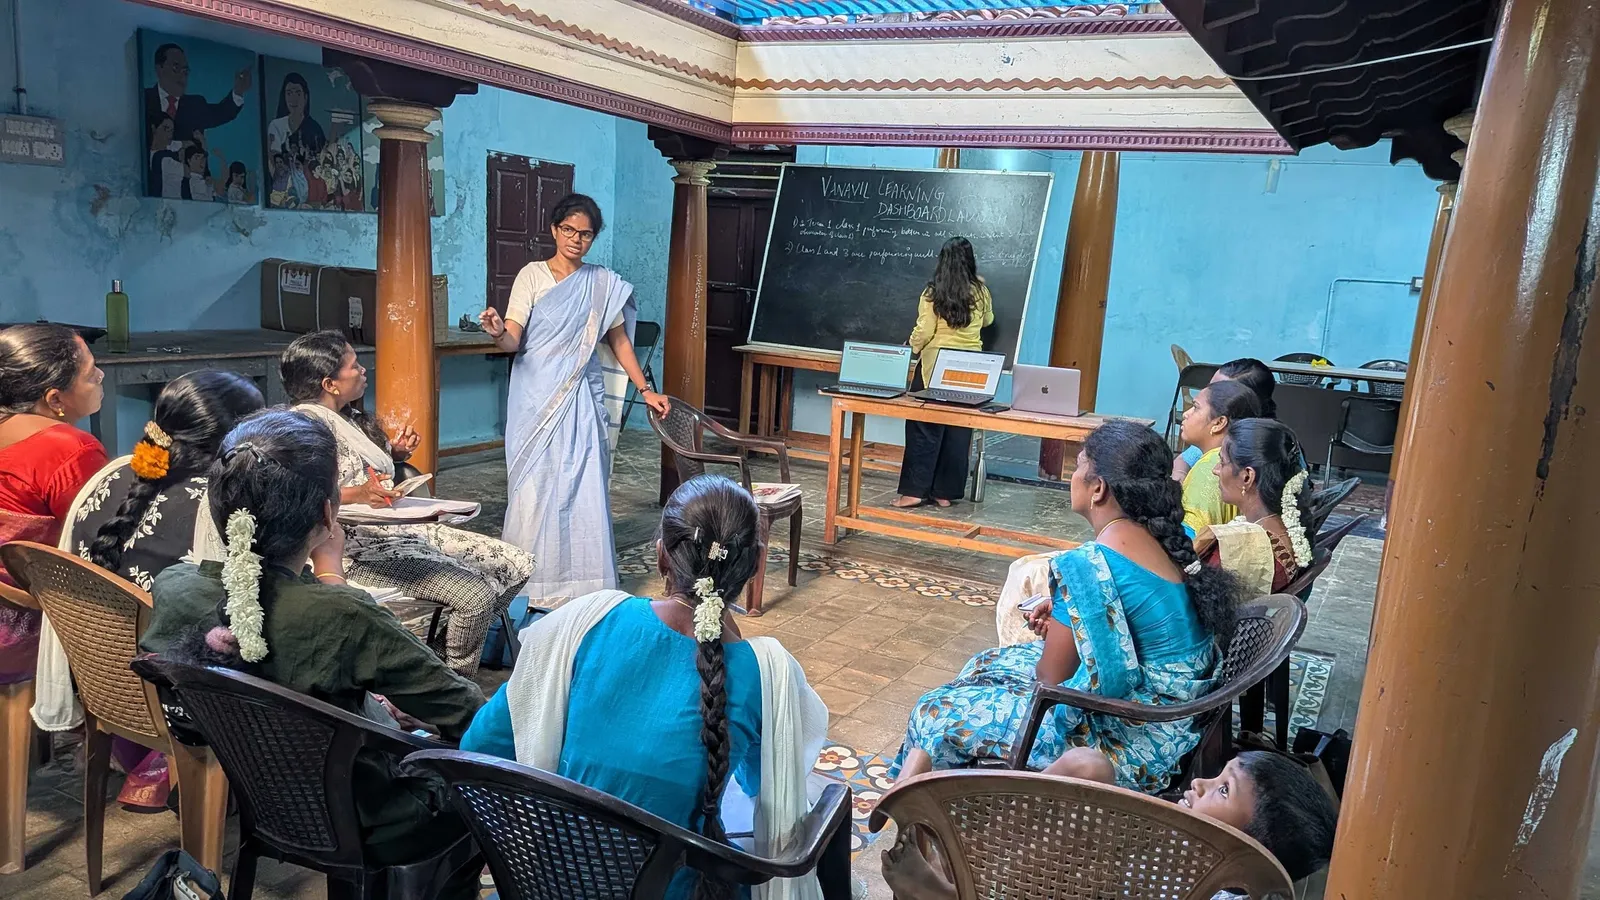
Teachers agreed on common competencies and a simpler assessment process, and a dashboard now compares learning across grades and terms.
We design dashboards and reporting views for both nonprofits and funders. We start with what questions you want your data to answer for you, and then build out a system that effectively showcases that.

Tap the ones that seem relatable to you.
Nothing tapped yet.
Tap any note that rings true for you.
our approach
Many dashboards fail because they begin with whatever data happens to be available. We begin with what leadership, programme teams, MEL staff or funders need to understand, decide and do, and design every view around those questions.
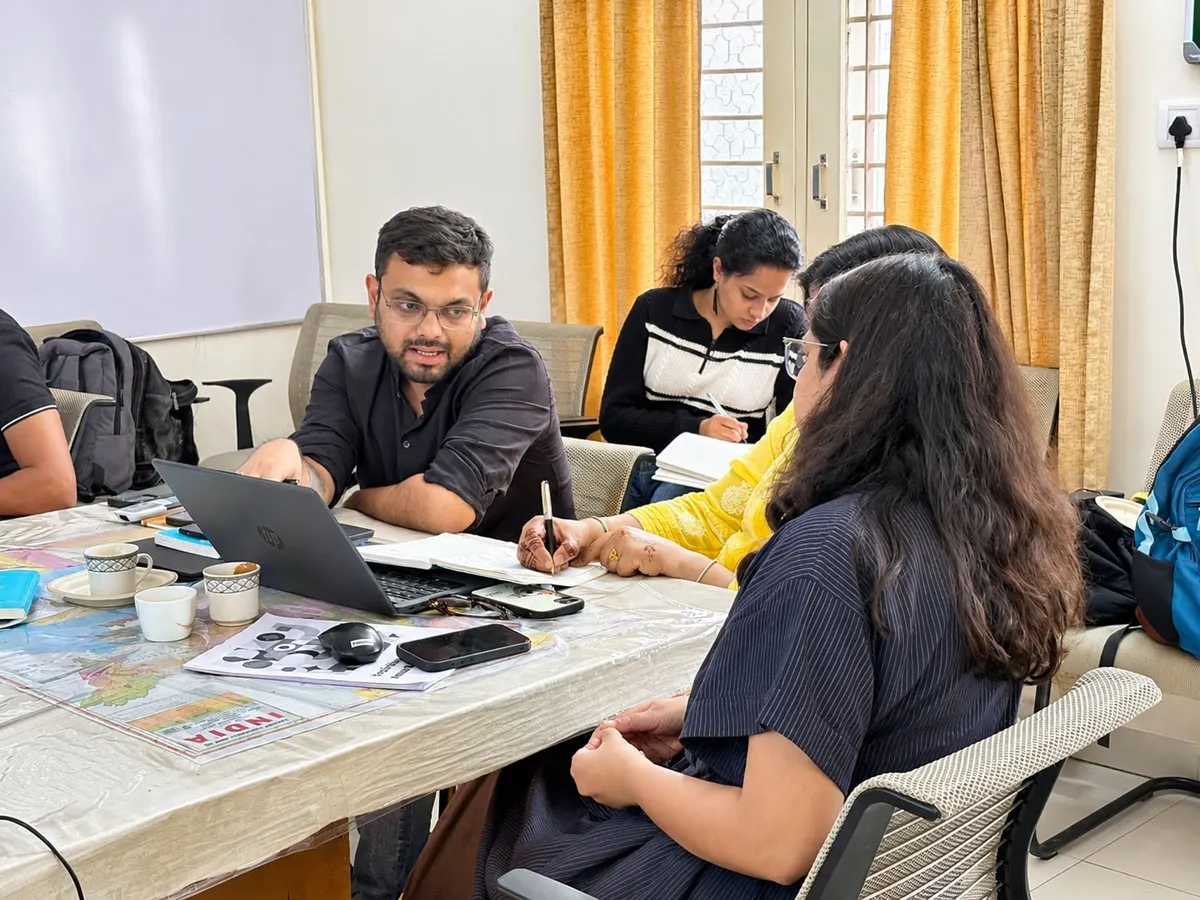
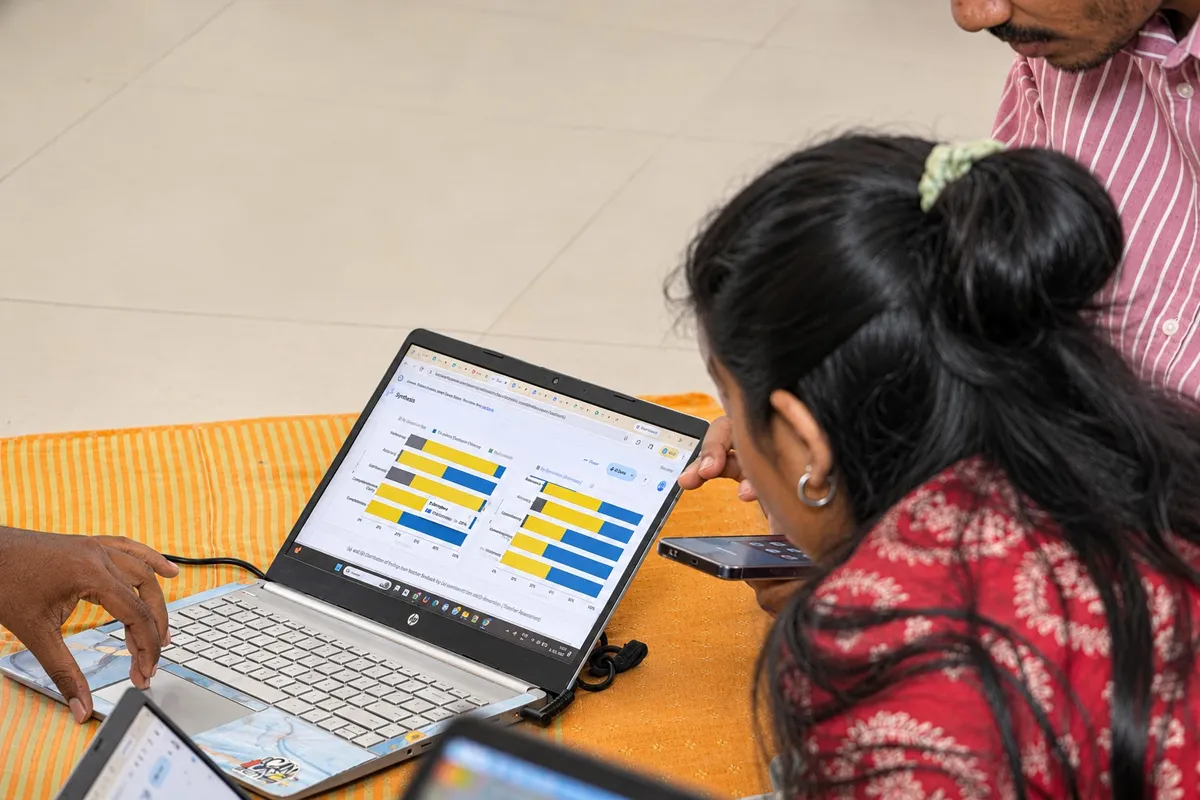
A dashboard is only as trustworthy as the definitions, data sources and pipelines behind it. If the measurement framework or underlying data system is not reliable, we address those foundations as part of the engagement.
Every role gets the dashboard view they need, with useful filters and drill-downs, and recurring reports are automated or simplified. We teach you how to onboard the people who will use the dashboard in the future and set up data-review routines that connect insight to action.
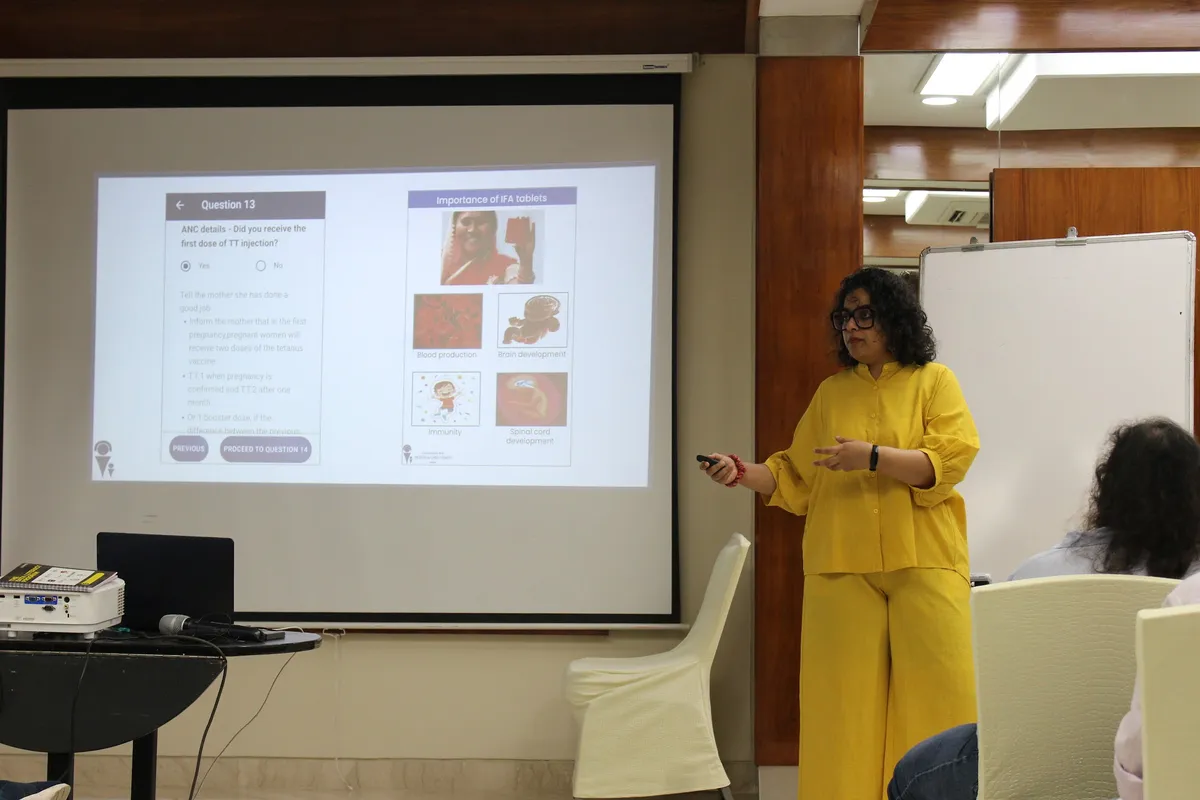
Role-specific dashboards and reporting views
Useful filters by programme, location, group or time period
Automated or simplified recurring reports
Onboarding and training for the people who use the dashboard
Data-review templates and routines that connect insight to action
Documentation, maintenance support and a structured handover
indicative duration
For dashboard design, build and testing within a wider measurement or data-systems engagement, depending on how ready the underlying data is and the number of user groups and views. An agreed maintenance and adoption period follows.
Months
Design dashboards and reporting systems that are intuitive, insightful and easy to work with.
Turn your Theory of Change into a measurement framework your organisation can use. We clarify the outcomes that matter, the questions your data needs to answer, and put in place the strategy you need to make that happen.
ExploreBuild an integrated data system that is easier to use today and strong enough to grow with you. We bring data entry, analysis and insight into one connected system, shaped around your programmes, roles and workflows.
ExploreBuild a data-confident workforce across your organisation. We conduct trainings and capacity building workshops that impart practical, role-specific learning. The primary goal is to get people to integrate data in their everyday work, so that it becomes a habit rather than a one-off event.
Explore